
To trade with a Symmetric triangle pattern here is everything that you should know about what is a Symmetrical triangle pattern.
What Is A Symmetrical Triangle Pattern?
A symmetric triangle pattern is formed when an asset’s price moves into a converging trendline, creating a triangular shape on the price chart. This pattern indicates periods of market consolidation and uncertainty, often preceded by significant price movements. The symmetrical triangle is considered a continuation pattern, meaning that the price will likely resume its previous trend after the pattern resolves.
A symmetric triangle pattern can be seen when the market is in Uptrend or Downtrend. A symmetric triangle pattern is identified by the sequence of lower highs and higher lows. When a Support Trend Line connects back-to-back lows and Resistance Trend Line connect back-to-back high, they result in a symmetric closure of two trend lines.

This symmetric triangle indicates that the market is in a situation where it is not deciding whether to go up or down wherein the force from buyer and seller is almost the same. In the end, the price gives a breakout to this triangle pattern, normally the breakout upside or downside is decided based on where the volume is high.
Most of the time the breakout direction gives at the previous trend to continuing on its trend, which means most of the time if the market was in an uptrend, the breakout direction at the upside to continuing on its Up trend, similarly, if the market was on the downside then the breakout direction seen as a downside to continuing on its Downtrend.
Characteristics of Symmetrical Triangle Patterns.
The symmetrical triangle pattern has several key features that traders should be aware of;
- Converging Trendlines: An upper trendline connects a series of lower highs, while a lower trendline connects a series of higher lows. As the pattern progresses, these trendlines come together, forming a triangle shape.
- Decreasing Price Volatility: As the price changes in the pattern, the range between the high and the low gradually narrows. This contraction in price volatility is characteristic of symmetrical triangles.
- Volume: Volume decreases as the pattern develops, indicating reduced enthusiasm and a decision not made among market participants.
Identifying & Draw A Symmetrical Triangle Pattern.
Identifying Entry Points in Symmetrical Triangle Patterns.
- Breakout Entry: A breakout occurs when the price decisively violates the upper or lower trendline of a symmetrical triangle. Traders often enter the market after breakout confirmation, as it indicates a possible continuation of the previous trend. For bullish breakouts, traders enter long positions, while for bearish breakouts, traders enter short positions.

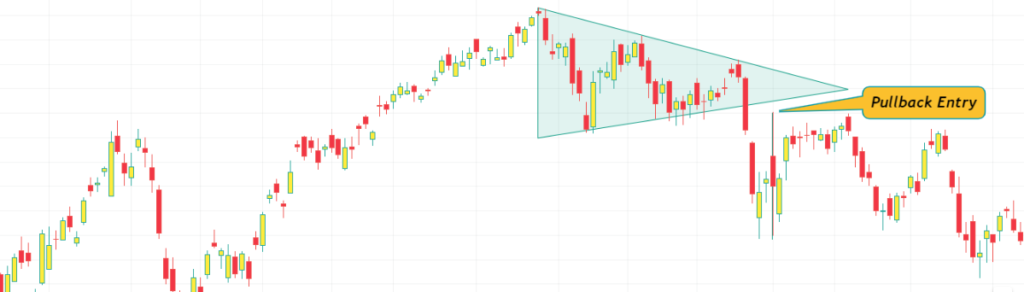
- Pullback Entry: Another entry strategy is to wait for a pullback after a breakout. After a breakout, it is common to retest the breakout level before resuming the price trend. Traders can take advantage of this pullback by entering positions towards the breakout, aiming for favorable risk-reward ratios.
Determining Exit Points in Symmetrical Triangle Patterns
- Target Price Exit: One approach to setting an exit point is to measure the height of a symmetrical triangle pattern. Starting at the base of the triangle, measure the vertical distance to the apex. This measurement can then be added to the breakout point for a bullish trade or subtracted for a bearish trade, providing a target price level.
- Stop Loss: In some instances, instead of breaking out, the price may break down from a symmetrical triangle pattern. Traders entering a bullish breakout should consider exiting their positions if the price breaks below the lower trendline. Conversely, traders entering in a bearish breakout should watch for a break above the upper trendline as a potential exit signal.

Implementing Effective Stop Loss Strategies.
- Percentage-Based Stop Loss: A commonly used stop loss strategy involves setting a predetermined percentage-based stop loss level. This percentage is often determined based on the trader’s risk tolerance and the volatility of the asset. For example, a trader may choose a 2% stop loss, meaning they will exit the trade if the price moves 2% against their position.
- Volatility-Based Stop Loss: Volatility plays an important role in determining the appropriate stop loss level. Using technical indicators such as Average True Range (ATR), traders can establish stop loss distances that account for the normal price fluctuations of the asset. This approach ensures that the stop loss is placed at a sufficient distance from the retail price fluctuations.
Conclusion.
Symmetrical triangle patterns are valuable tools in technical analysis, giving traders an insight into potential price movements. By understanding entry points, and exit points and implementing effective stop-loss strategies, traders can make informed trading decisions and manage risk more effectively. Remember to combine technical analysis with other indicators, do thorough research, and practice prudent risk management to increase the probability of successful trades. As with any trading strategy, constant learning, adaptation, and refinement are key to staying ahead in the dynamic world of financial markets.