
Kewal Kiran Clothing Limited is one of India’s few large branded apparel manufacturers. In this article, we will see how the KKCL Share Price is performing in the Indian Stock Market.
About Kewal Kiran Clothing Limited (KKCL).
Kewal Kiran Clothing Limited is integrated in 1981 and its headquarter is located in Mumbai. Kewal Kiran Clothing Limited designs, manufactures, and markets branded jeans, and a wide range of apparel and lifestyle products for men and women.
Kewal Kiran Clothing Limited (KKCL) Top Brands.
Kewal Kiran Clothing Limited top brands and products are listed below, we have seen these top brand products stores in many Shopping malls.
1) Killer

2) K-Lounge

3) Lawman/Lawman Pg3

3) Integriti

4) Easies

KKCL Stock Price Review.
Kewal Kiran Clothing Limited has given a consistently profitable business and given good quarterly results. The KKCL stock on a price chart has shown good strength in the company.
KKCL stock price movement is most of the time seen as bullish on the price chart which includes some ups and downs. The KKCL stock has given a very healthy dividend payout to its investors and consistently maintained the dividend every year, at the end of this post, we will see the KKCL dividend history.
At the end of 2021, the KKCL stock price was between Rs. 1200 to Rs 1300, here the KKCL stock has declared the Bonus with a ratio of 4:1 which was very beneficial for the huge quantity holders as they received 4 additional shares against the 1 share. However, with this bonus, the stock price was split to around Rs 280.
After the Bonus and split, the KKCL stock price kept moving up. The KKCL stock price is looking strong with Fundamentally as well as technically also, at the time of writing this post the KKCL Share price is at Rs. 549.65 and looking bullish on the price chart.
KKCL Stock Price With Technicals.
We will apply some technical indicators to understand the stock movements, growth, and good points for entry levels.
KKCL Stock Price With 200 Moving Average.

The above is the KKCL stock price chart just after the last Bonus split. Here, we can see the KKCL stock price has shown a very decent movement even during the heavy volume in the market. The stock price looks to follow the 200 Moving Average level as the stock price is bouncing from this same level.
KKCL Stock Price With Trend Line.
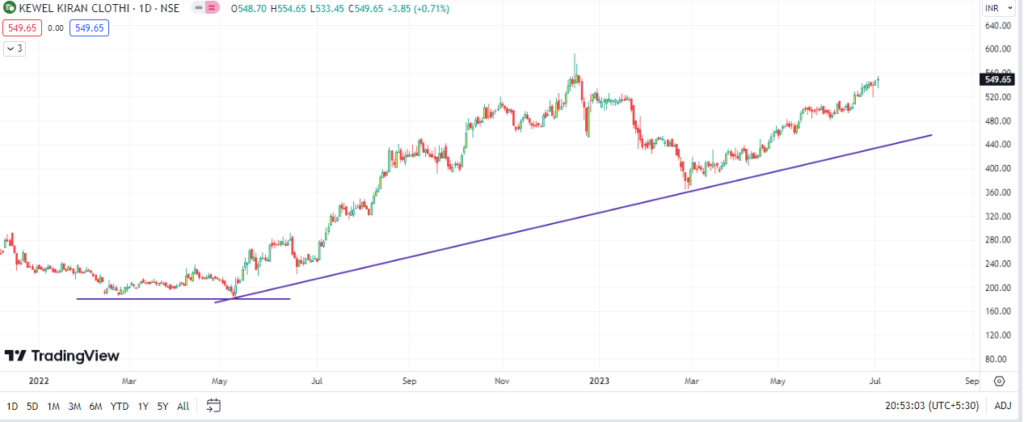
KKCL stock price with a trend line is showing the price is keep moving upside with higher high formation. However, there are downsides seen but as per the 1-day candle chart the KKCL stock price has taken the Trend line support and stock price bounced from it. Trend line level can be one of the good points to take entry into the stock.
KKCL Stock Price With Support & Resistance.
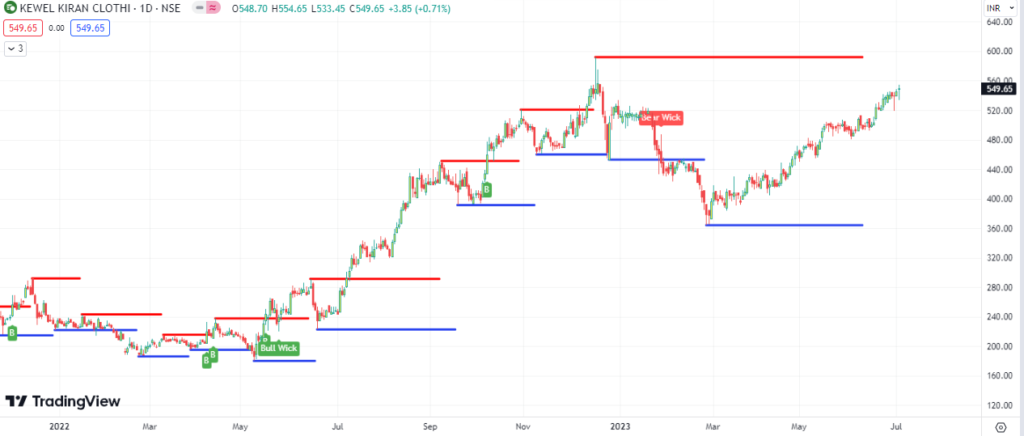
According to the Support and Resistance, the KKCL Stock price looks under the overbought zone at this moment as the resistance level is very close. At this movement, it will be good to monitor the KKCL stock and see if the somehow price comes down so that fresh entry can take at the support level.
If the KKCL price gives a breakout to the resistance level then also fresh entry can take immediately but with a minor quantity as after the breakout to resistance, it is important to see if the price comes down at the same resistance level to retest and if stock price moving up from the same level then more quantity can add. Consider stock in an overbought zone as per Support and Resistance, the stop loss is a must needed and it can be the previous support level.
Must Read: Which Stocks To Buy For Long Term Investment.
KKCL Stock Price with Fundamental.
As per the screener, we will see some key points in Fundamental, below are the same.
KKCL Share Quarterly Results.
The below quarterly result figures are in Crores.
| Mar 2020 | Jun 2020 | Sep 2020 | Dec 2020 | Mar 2021 | Jun 2021 | Sep 2021 | Dec 2021 | Mar 2022 | Jun 2022 | Sep 2022 | Dec 2022 | Mar 2023 | |
|---|---|---|---|---|---|---|---|---|---|---|---|---|---|
| Sales + | 127 | 7 | 67 | 118 | 111 | 92 | 175 | 171 | 170 | 155 | 226 | 199 | 199 |
| Expenses + | 105 | 23 | 56 | 105 | 101 | 84 | 143 | 144 | 137 | 125 | 176 | 166 | 160 |
| Operating Profit | 21 | -16 | 11 | 13 | 10 | 8 | 32 | 28 | 32 | 29 | 50 | 34 | 39 |
KKCL Share Profit & Loss Standalone.
Below are the Profit & Loss Standalone figures in Crores.
| Mar 2012 | Mar 2013 | Mar 2014 | Mar 2015 | Mar 2016 | Mar 2017 | Mar 2018 | Mar 2019 | Mar 2020 | Mar 2021 | Mar 2022 | Mar 2023 | |
|---|---|---|---|---|---|---|---|---|---|---|---|---|
| Sales + | 294 | 294 | 363 | 398 | 444 | 466 | 460 | 503 | 530 | 303 | 608 | 779 |
| Expenses + | 221 | 220 | 270 | 301 | 340 | 368 | 362 | 391 | 435 | 284 | 508 | 628 |
| Operating Profit | 73 | 74 | 93 | 97 | 104 | 99 | 98 | 112 | 95 | 19 | 100 | 152 |
KKCL Share Balance Sheet.
Below are the Balance Sheet Standalone figures in Crores.
| Mar 2012 | Mar 2013 | Mar 2014 | Mar 2015 | Mar 2016 | Mar 2017 | Mar 2018 | Mar 2019 | Mar 2020 | Mar 2021 | Mar 2022 | Mar 2023 | |
|---|---|---|---|---|---|---|---|---|---|---|---|---|
| Share Capital + | 12 | 12 | 12 | 12 | 12 | 12 | 12 | 12 | 12 | 12 | 62 | 62 |
| Reserves | 213 | 242 | 278 | 307 | 286 | 362 | 387 | 418 | 434 | 421 | 417 | 486 |
| Borrowings + | 15 | 14 | 12 | 11 | 29 | 41 | 48 | 93 | 91 | 50 | 82 | 66 |
KKCL Share Dividends History.
KKCL stock has given consistent dividends, from 2006 to till now, KKCL has declared a total of 55 dividends. At the time of writing this article, the KKCL stock dividend yield is 2.03 %. Below is the dividend history of KKCL stock till today 5th July 2023.
| Ex-Date | Dividend Amount | Dividend Type | Record Date | Instrument Type |
|---|---|---|---|---|
| May 11, 2023 | 2.00 | INTERIM | May 11, 2023 | Equity Share |
| Nov. 4, 2022 | 3.00 | INTERIM | Nov. 7, 2022 | Equity Share |
| May 20, 2022 | 5.00 | INTERIM | May 23, 2022 | Equity Share |
| Feb. 7, 2022 | 4.00 | INTERIM | Feb. 8, 2022 | Equity Share |
| Nov. 11, 2021 | 10.00 | INTERIM | Nov. 12, 2021 | Equity Share |
| Feb. 3, 2021 | 8.00 | INTERIM | Feb. 4, 2021 | Equity Share |
| Nov. 3, 2020 | 15.00 | INTERIM | Nov. 4, 2020 | Equity Share |
| Sept. 7, 2020 | 1.00 | FINAL | – | Equity Share |
| June 4, 2020 | 6.00 | INTERIM | June 5, 2020 | Equity Share |
| Feb. 6, 2020 | 15.00 | INTERIM | Feb. 7, 2020 | Equity Share |
| Nov. 4, 2019 | 10.00 | INTERIM | Nov. 5, 2019 | Equity Share |
| Sept. 9, 2019 | 2.00 | FINAL | – | Equity Share |
| July 1, 2019 | 11.00 | INTERIM | July 2, 2019 | Equity Share |
| March 18, 2019 | 5.00 | INTERIM | March 19, 2019 | Equity Share |
| Feb. 1, 2019 | 10.00 | INTERIM | Feb. 4, 2019 | Equity Share |
| Nov. 5, 2018 | 10.00 | INTERIM | Nov. 6, 2018 | Equity Share |
| Aug. 30, 2018 | 1.50 | FINAL | – | Equity Share |
| July 31, 2018 | 7.00 | INTERIM | Aug. 1, 2018 | Equity Share |
| March 20, 2018 | 5.00 | INTERIM | March 21, 2018 | Equity Share |
| Jan. 30, 2018 | 9.50 | INTERIM | Jan. 31, 2018 | Equity Share |
| Oct. 26, 2017 | 10.00 | INTERIM | Oct. 27, 2017 | Equity Share |
| Aug. 30, 2017 | 1.50 | FINAL | – | Equity Share |
| May 5, 2017 | 7.00 | INTERIM | May 8, 2017 | Equity Share |
| Feb. 7, 2017 | 8.50 | INTERIM | Feb. 8, 2017 | Equity Share |
| Nov. 8, 2016 | 9.00 | INTERIM | Nov. 9, 2016 | Equity Share |
| Aug. 30, 2016 | 1.50 | FINAL | – | Equity Share |
| March 17, 2016 | 7.00 | INTERIM | March 19, 2016 | Equity Share |
| Feb. 16, 2016 | 8.00 | INTERIM | Feb. 17, 2016 | Equity Share |
| Nov. 19, 2015 | 8.50 | INTERIM | Nov. 20, 2015 | Equity Share |
| Aug. 20, 2015 | 1.50 | FINAL | – | Equity Share |
| June 25, 2015 | 35.00 | INTERIM | June 26, 2015 | Equity Share |
| May 25, 2015 | 3.00 | INTERIM | May 26, 2015 | Equity Share |
| Feb. 10, 2015 | 5.00 | INTERIM | Feb. 11, 2015 | Equity Share |
| Oct. 30, 2014 | 7.50 | INTERIM | Oct. 31, 2014 | Equity Share |
| Sept. 25, 2014 | 8.00 | INTERIM | Sept. 27, 2014 | Equity Share |
| Aug. 19, 2014 | 1.50 | FINAL | – | Equity Share |
| May 20, 2014 | 5.00 | INTERIM | May 21, 2014 | Equity Share |
| Feb. 4, 2014 | 7.00 | INTERIM | Feb. 5, 2014 | Equity Share |
| Oct. 24, 2013 | 7.50 | INTERIM | Oct. 25, 2013 | Equity Share |
| Aug. 13, 2013 | 1.00 | FINAL | – | Equity Share |
| May 21, 2013 | 3.00 | INTERIM | May 22, 2013 | Equity Share |
| Feb. 25, 2013 | 6.50 | INTERIM | Feb. 26, 2013 | Equity Share |
| Nov. 22, 2012 | 7.00 | INTERIM | Nov. 23, 2012 | Equity Share |
| July 25, 2012 | 4.00 | FINAL | – | Equity Share |
| March 15, 2012 | 6.00 | INTERIM | March 16, 2012 | Equity Share |
| Nov. 3, 2011 | 7.00 | INTERIM | Nov. 4, 2011 | Equity Share |
| Aug. 18, 2011 | 4.00 | FINAL | – | Equity Share |
| April 13, 2011 | 6.00 | INTERIM | April 16, 2011 | Equity Share |
| Nov. 8, 2010 | 6.50 | INTERIM | Nov. 9, 2010 | Equity Share |
| July 21, 2010 | 6.00 | FINAL | – | Equity Share |
| July 17, 2009 | 3.00 | FINAL | – | Equity Share |
| July 18, 2008 | 2.00 | FINAL | – | Equity Share |
| Nov. 5, 2007 | 2.00 | INTERIM | Nov. 6, 2007 | Equity Share |
| July 23, 2007 | 2.50 | FINAL | – | Equity Share |
| Aug. 30, 2006 | 1.50 | FINAL | – | Equity Share |
Conclusion.
We have seen KKCL stock with some different technical indicators and also see some fundamental, overall the KKCL stock price looks to have good strength. As per the KKCL price on the chart, it has shown a good indication of profitability & efficiency. KKCL stock can be one of the good choices in a portfolio for the long term.
Frequently Asked Questions about KKCL Share Price.
-
What is the PE ratio of KKCL share price?
As on 5th July 2023, the PE ratio of KKCL share is 28.4.
-
What is the total market capital of KKCL share ?
As on 5th July 2023, the total market capital of KKCL is ₹ 3,383/- crore.
-
What is the 52-week High of KKCL Share?
As on 5th July 2023, the KKCL Share 52-week high is Rs. 592.00.
-
What is the 52-week Low of KKCL Share?
As on 5th July 2023, the KKCL Share 52-week low is Rs. 245.60.
-
What is the Dividend Yield of KKCL Share?
As on 5th July 2023, the KKCL Share Dividend Yield is 2.01 %.
-
What is the ROCE of KKCL Share?
As on 5th July 2023, the ROCE of KKCL Share is 27.9 %
-
What is the ROE of KKCL Share?
As on 5th July 2023, the ROE of KKCL Share is 23.3 %
-
Is KKCL a good stock to buy?
As per the technical and Fundamental, it looks like there is a high potential in the KKCL stock price. KKCL stock can be one of the good choices for the portfolio for the long term, and also best for a compounding point of view. However, please do your own research or consult with your fund advisor before any investment.
-
How to Buy KKCL Share?
Disclaimer: The information and mentioned stocks in this post is just an author’s view and is just for entertainment, education, and information purpose and it does not indicate any kind of investment. Please perform your own research and take advice from your fund advisor.